Digital Signage Analytics — Measuring ROI and Audience Engagement
The Measurement Problem
Digital signage has historically been hard to measure. Unlike a web page (trackable with analytics) or an email (trackable with open and click rates), a screen in a physical space doesn’t naturally generate data. This has led some organisations to treat screens as “hope and pray” media — deployed and forgotten.
Modern digital signage analytics change this. With the right tools and approach, you can measure reach, engagement, and business impact with reasonable confidence.
The Alliance Analytics Dashboard
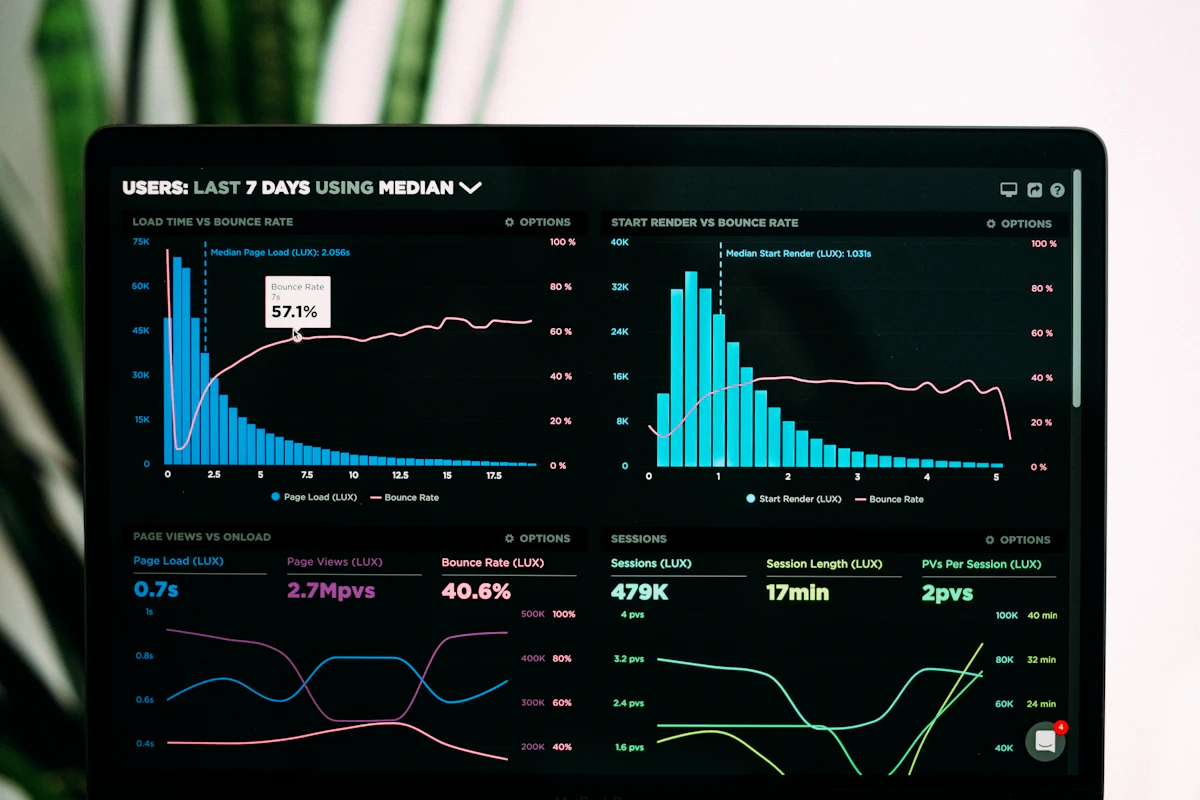
The Alliance platform provides built-in analytics for every screen in your network:
Proof of play — A log of every piece of content displayed on every screen, with start time, duration, and screen name. Essential for ad-serving accountability and regulatory compliance.
Screen uptime — Each player reports its status to the dashboard. Uptime reports show which screens have been online and playing content. Identify screens that have been offline and need attention.
Content performance — Which content pieces are displayed most, which playlist templates are used across which screens, and content update frequency.
Screen inventory — A complete inventory of your screen network: location, screen size, player model, software version, and last-seen time.
Audience Measurement
Passive audience measurement uses sensors and cameras with computer vision (not facial recognition) to estimate:
- Footfall — How many people pass by the screen
- Dwell time — How long people look at the screen
- Demographic estimation — Age range and gender (anonymised, aggregate)
- Attention — Whether the viewer’s face is directed toward the screen
The Alliance integrates with leading audience measurement providers including Quividi, Broadsign Mediacaster, and custom camera systems.
Important ethical note: Audience measurement using cameras must comply with GDPR and local privacy laws. Data should be anonymised and aggregated — no individual tracking, no biometric data storage. Display a notice informing visitors that audience measurement is in use.
Correlating with Business Outcomes
The most compelling measurement approach is correlation with business outcomes:
Retail — Compare sales of promoted products in locations with screens showing the promotion vs. comparable locations without. Control for other variables (time of year, weather, promotions).
Food service — Compare average check size before and after digital menu board installation. Track which daypart shows the largest change.
Internal communications — Survey employee awareness of key messages before and after a screen campaign. Track participation rates in promoted events or programmes.
Healthcare — Track appointment attendance rates before and after appointment reminder screens. Measure patient satisfaction scores.
Key Metrics by Use Case
Retail digital signage:
- Sales uplift for promoted products
- Dwell time near screen (longer dwell = more influence)
- Conversion rate from screen viewer to purchaser
Restaurant menu boards:
- Average check size
- Item mix (percentage of orders including promoted items)
- Wait time and queue length
Corporate communications:
- Employee awareness of key messages (survey)
- Participation in promoted events
- Reduction in support desk enquiries for communicated information
Transportation wayfinding:
- Reduction in staff wayfinding enquiries
- Visitor satisfaction scores
A/B Testing
The Alliance’s scheduling system allows A/B testing of content:
- Create two versions of a piece of content
- Schedule version A on screens in location group A
- Schedule version B on screens in location group B
- Compare business outcomes (sales, conversions, survey responses)
- Roll out the winning version
This is the same approach used by digital marketers and applies equally to physical screen networks.
Reporting and Accountability
For organisations managing screens for clients or internal stakeholders:
- Scheduled automated reports sent by email (weekly, monthly)
- API access to proof-of-play data for integration with ad trafficking systems
- Exportable logs in CSV format for ad reconciliation
- Custom dashboards for specific KPIs
The Alliance’s reporting suite makes it straightforward to demonstrate the value of your screen network to anyone who asks.